
Friday Digital Roundup
The Friday Digital Roundup is a witty take on the weird world of the internet. With fun stories from around the globe, it’s the only email newsletter you’ll actually read and enjoy!
We do love writing it, but clearly not as much as people like receiving it - just look at the response we got when a technical hitch meant it wasn’t sent out on time!
@roisinduffyVA @roisinduffyva
@Spaghetti_Jo
Coffee and the FDR is how I start my Friday.
Do not engage until I have devoured both
Meschi Consultants @MeschiConsult
When it comes to the end of the week, there is no better way to start a Friday than with a run around the internet with Todd and Jo in the FDR. Just don't let them know I do it from the loo!
Kathryn Lynch-Smith @KikikatSmith
@Spaghetti_Jo
My inbox is full of rubbish newsletters that Im constantly deleting😬 My VIP inbox is for 1 thing only- THE DIGITAL ROUNDUP🤠I dont read a Newspaper or the news online, I just wait for Fridays, when this lands in my inbox- then I know ‘The weekend has landed’🤗
Get the Friday Digital Roundup and see what everyone’s talking about.
We may look like cowboys, but we’ll never abuse your data! Find out what we’ll do with it here, partner.
Spaghetti Blog
Tuesday 8th July 2025
How to Master Twitter Analytics and Improve your Success Today
I’ve always been a lover of analytics and data. Everyone’s talking about how important data is for content marketing and they’re right!
Data doesn’t have to be BIG or even scary; it just has to make sense to you and be worth spending time on. Twitter is an awesome tool for business and pleasure and one thing that fascinates me is that it’s so complex, even though on the surface it seems so simple.
Like anything in marketing, you need to know what’s working and how you can improve it or just keep doing what you’re doing. Twitter is no different. Here’s how to use data (not big scary data) to smash your Twitter success barrier.
How to Master Twitter Analytics and Improve your Success Today
Twitter Analytics
Since Twitter floated on the stock exchange it’s all got a bit serious. The advertising option has arrived and with that comes the data and Analytics. Analytics are really cool and are a great asset to your Twitter but…
… Analytics of any kind are worthless if you don’t know how to use them!
Looking at pretty graphs and huge figures is not going to help you if they mean nothing to you. I’m going to break it down and explain what it all means for you, your tweeting and your marketing. So let’s jump in.
Firstly, you need to log in. Go to https://analytics.twitter.com and log in with your Twitter account.
You’ll see your dashboard. This is the engine of your Twitter. This is like the diagnostics report from your car’s ECU. This is where you see what’s working… and what’s clearly not.
Let’s break it down
In the top right you have a date range that you can set. I like to test stats from a given month so I’ve set mine for the 1st to the 31st October. You can set yours to whatever month you’re in now.
This allows you to look at decent chunks of data and have bite-size results and figures. It’s easier to deal with.
Set the analytics to ‘Tweets’ and view what you’ve sent
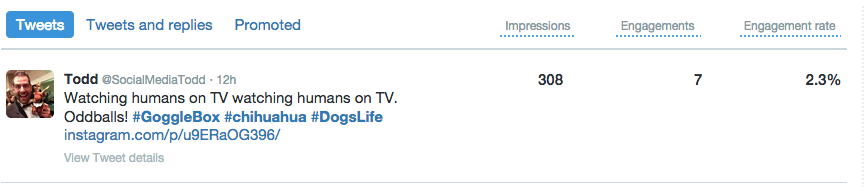
Tweets – all your sent tweets
Here you’ll find all the tweets you sent in the given period set by the calendar that you just played with. It’s all fairly self-explanatory:
- Impressions – how many people potentially saw your tweet (or how many followers were around at the time).
- Engagements – how many people interacted with your tweet. This can be a reply, retweet or simply a click on your link or image.
- Engagement rate – this is a percentage based on how many people saw your tweet to how many actually bothered to interact. This will be fairly low.
What you need to focus on here is what works with your followers and what doesn’t. It’s that simple. If you’re spending time on Twitter sending out content and updates and no one sees them then it’s a waste of energy as well as being de-motivating,
Go through your tweets (yes all of them) from a month and look at what’s working and which tweets seem to go unnoticed.
A really quick way to do this is to look at the graph at the top. Here you can simply go to the highest point (your most popular tweet) and find the date located at the bottom. Then scroll down to that tweet and see what you did, when you sent it and what the tweet was about.
You should have several top performing tweets and this is the best place to start. Find those tweets and see why they were so damn popular. Then (and this is the important part) learn from it! Use that formula again.
Here are some pointers:
- If you got more clicks because you had an image then use more images.
- If a certain type of image got more interaction – do more of those.
- If your blog gets less clicks than when you share other people’s blogs then write better blog titles!
- If your late night tweets reach more people (higher impressions) then tweet more at night.
- If your tweets get a higher engagement rate at lunch time and the impressions are relatively high then that’s your sweet spot.
Note: Generally speaking, images get more engagement as your followers will have to click on them to see the full size. Bear this in mind. You may be getting higher engagement but these aren’t replies, clicks to your website, or retweets. Remember why you’re on Twitter in the first place. Is this helping you?
Tweets and replies
This is everything you send out (your tweets and the replies to others) and the data here can be slightly overwhelming to start with. But, a quick glance might show that when you speak to certain people on Twitter you gain more reach and more interactions. You might want to interact with these people more.
Promoted
This is why all this is free. Twitter now allows you to promote your tweets and get to a larger audience. Here you will find any of your promoted tweets and how far they went and the engagement that they got. If you’re using Twitter ads then you should use the same rules as above and apply them here.
 Graphs and overview of tweets
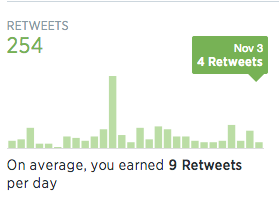
On the right hand side you’ll find some graphs that give you an overview of the period of time that you selected in the date range at the top.
This is a really nice snapshot of your Twitter activity. Again, just look for the higher points and try to work out what you did. Repeat this for more engagement and better click throughs or whatever you’re trying to achieve on Twitter.
Followers – who are they and what do they like?
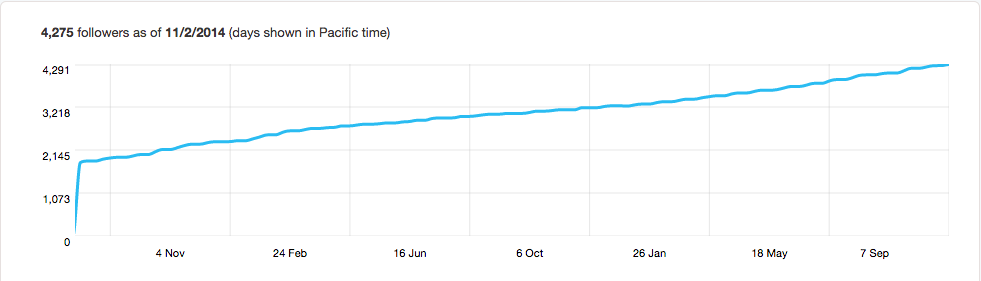
Let’s look at your followers and understand what they’re about. Select ‘followers’ from the very top of your screen and you’ll be given a great-looking screen all about your dear, lovely followers.
All this tweeting is great if you’re gaining and talking to the right people. Here you’ll find some great data that will tell you how you’re doing.
Firstly you get a great big graph showing your (hopefully) rising follower numbers. If you have drops or peaks then track back to your tweets to see what happened. Improve it or repeat.
Next you’ll find three areas that your followers have been categorises into, and this is vital information!
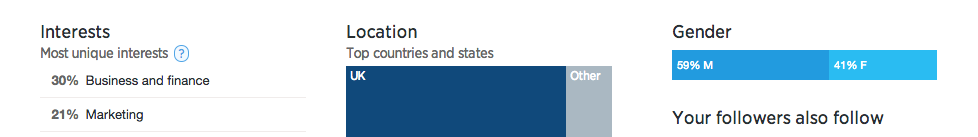
Interests
Knowing what your followers like is important for two reasons:
- You can tweet more about what they like.
- You can try and figure out why you have non-related followers.
For example. I share news, articles and blogs from me and others about tech, social media, SEO and other marketing news. I would expect to find followers that have these interests.
I do have followers like this and I’m happy that because of the content I share, I attract people who are interested in me. I’m also attracting followers who have an interest in business and finance, which is good for me as I’m trying to market to other businesses. I’m attracting the right people.
If your followers have interests in content and topics that are nothing to do with your business or interests then you need to go back and look at what you’re sharing and who you’re following. There’s no point in having an un-targeted audience of space travel fans if you sell flowers.
Location
The next column is simple enough; where your followers come from. This is important if you have a local focus or like me are targeting bigger cities and companies.
Use this with caution though. I’m always cautious of geographical data as so much depends on how this is collected. It’s going to be fairly accurate but don’t rely 100% on it as it’s relying on followers providing their location in their bio or where they tweet from. Not everyone does this.
Gender
Pretty obvious this one, but if your product or service is very much for one gender only then you need to make sure your following is too. Or maybe you want an all-male audience because your product is a gift for a female? Whatever you need to have, make sure you’re getting it right.
Caution: I don’t know how Twitter know this. I don’t remember ever telling Twitter what gender I am. I’ve just signed up a client to Twitter and it didn’t ask me. I’m not sure how accurate these stats are but mine make sense, so somewhere along the lines Twitter are getting it right.
 Your followers also follow – this is gold!
If you do nothing else then use this area. This is a brilliant use of data and a really simple way to find more followers who are like your current ones (if they’re what you want).
Twitter will show you who your followers also follow and this is powerful data. If they like you and they like other accounts then chances are that people who follow these other accounts that don’t follow you might be interested in you.
Get following the people from these accounts that you’re not already following. I like to use a tool called ManageFlitter for this, but you can simply go to the Twitter account in question, go to its followers and start following.
This is very much like the ‘similar audience’ feature in Facebook where you can find people who are similar to your current tribe of fans. It’s a great way to increase your audience but only if you’re happy with the audience that you have already… Otherwise you’ll add more irrelevant followers.
Big data and Twitter – get intelligence on your actions
Marketing ain’t a thing without measuring. Get your act together and start using data and making it work for you. Twitter is giving us this data for free and you really need to get into to it to improve and grow on Twitter:
- Tweet more of the good stuff
- Tweet less of the bad
- Tweet at the right times
- Follow more of the right people
- Make sure you’re attracting the right kinda followers
- If you’re a local account – get more local followers!
Getting to grips with Twitter Analytics is simple and there’s not too much data (which can be overwhelming). Get over to https://analytics.twitter.com now and start working on your account.
What do you think of Twitter analytics? Does data scare you? Tell me in the comments below or shout at me on Twitter @SocialMediaTodd.
For more tips on Twitter, read this post on growing your Twitter following or for tips on Twitter tools read 6 Twitter tools I can’t live without.
Do You Struggle to Create Content to Generate Sales?
We’ve Created a FREE Online Marketing Plan…
Use our simple ideas generator to help you make better content, over and over again…
Tags associated with this article
Analytics TwitterPost a comment
We'd love to know what you think - please leave a comment!
99 Simple Marketing Tips
99 Simple Marketing Tips You Can Use to Treble Your Business
Struggling to know where to start with your digital marketing?
We’ve got a tonne of ideas that you can put in place for your marketing – directly from our past 8 years growing an engaged following and strong business.

What You’ll Get
- #ToddsTips
- 4Networking
- AI
- Blogging
- Brand
- Business
- Content
- Content Marketing
- Copywriting
- Digtial Marketing Trends
- Email marketing
- Facebook Ads
- Facebook Groups
- Facebook Live
- Google Adwords
- Hashtags
- How to
- Marketing
- Networking
- Outsourcing
- PPC
- PR
- Press Releases
- Proofreading
- SEO
- Social
- Social Media
- Spaghetti Agency
- Storytelling
- Technology
- Uncategorised
- Video
- Video marketing
- Vision
- Websites
- Workshops
- YouTube


0 comments on this article