
Friday Digital Roundup
The Friday Digital Roundup is a witty take on the weird world of the internet. With fun stories from around the globe, it’s the only email newsletter you’ll actually read and enjoy!
We do love writing it, but clearly not as much as people like receiving it - just look at the response we got when a technical hitch meant it wasn’t sent out on time!
@roisinduffyVA @roisinduffyva
@Spaghetti_Jo
Coffee and the FDR is how I start my Friday.
Do not engage until I have devoured both
Meschi Consultants @MeschiConsult
When it comes to the end of the week, there is no better way to start a Friday than with a run around the internet with Todd and Jo in the FDR. Just don't let them know I do it from the loo!
Kathryn Lynch-Smith @KikikatSmith
@Spaghetti_Jo
My inbox is full of rubbish newsletters that Im constantly deleting😬 My VIP inbox is for 1 thing only- THE DIGITAL ROUNDUP🤠I dont read a Newspaper or the news online, I just wait for Fridays, when this lands in my inbox- then I know ‘The weekend has landed’🤗
Get the Friday Digital Roundup and see what everyone’s talking about.
We may look like cowboys, but we’ll never abuse your data! Find out what we’ll do with it here, partner.
Spaghetti Blog
Saturday 27th June 2026
Six Simple Areas Every Small Business Needs to Look in Google Analytics…
If you ran a shop you’d monitor which promotions and displays worked. You’d know your regular customers and you’d have a strong instinct for what sold in your shop and what didn’t.
You’d have your eyes open when people came into your shop. You’d know what they picked up and put down without buying and you’d know what you needed to put right in front of their eyes.
(Supermarkets hide the milk right at the back of the store on purpose, you know. And companies pay for their goods to be displayed at eye height, which is why you’ll find cheaper biscuits on the bottom shelf. Thank me later.)
Even if you don’t sell on your website, the chances are you’re still looking for sales from it. You’ll have content, a contact form, and information about you that you want people to see, read and action.
The simple fact is: your website is a shop and you’re the shopkeeper.
You need to keep an eye on what people do in your shop and work out the best (and worst) pages. Learn to work on improving them and making them work harder for you when you’re not in the shop… which is pretty much all the time.
Google Analytics (GA) is free and brilliant. It allows access to Google to crawl and view your website and in return gives you some really great data… but almost too much data. It can be overwhelming if you don’t know where to look.
Which is why I’m writing this for you.
Six Simple Areas Every Small Business Needs to Look in Google Analytics…
I often think that there should be a ‘Fisher Price’ option for Google Analytics. A simple switch that gives you the basic reports that you need, instead of access to ALL DATA which scares the crap out of most newbies.
It’s like anything, you just want to do what you’re good at and you don’t necessarily want to go all technical with this kind of thing.
So, I wanted to show you my ‘go to’ reports and show you how to get to them.
My hope is that you’ll open your eyes in your shop and work on better promotional stands and make sure the milk is in right place.
Let’s take a look…
Firstly, if you don’t have GA on your website, you really should fix that. My aim here is not to show you how to install the code though so if you’re not already set-up then check out this article by Google on how to do it.
Once you’re logged into GA, there are some key places to look for and a few housekeeping rules too
Firstly, you’ll want to look at a decent segment of data. Looking at a few days can give you some interesting results if you’ve been heavily marketing or a blog you wrote was very popular, but most of the time you’ll want to look at a few months of data at least.
So, head to the left of your dashboard and click on ‘Audience’ and then ‘Overview’ to reveal the calendar at the top right of your dashboard.
Then change the date range to something like three months by clicking on the current date range to reveal the dropdown calendar.
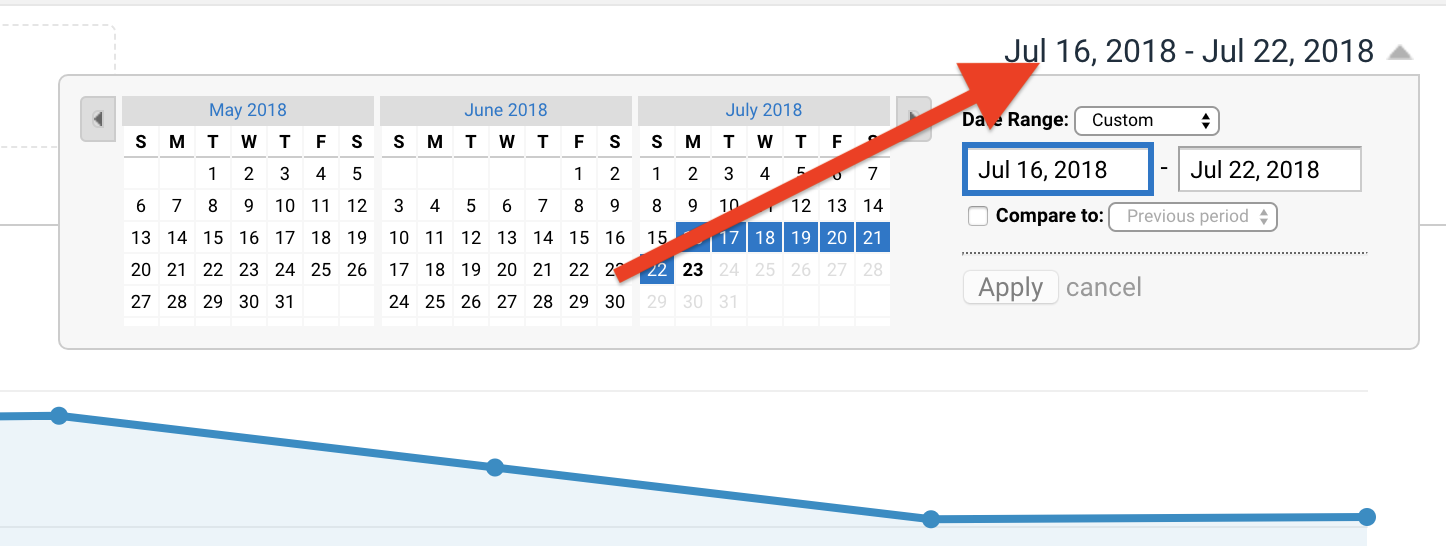
And now we can play with the reports…
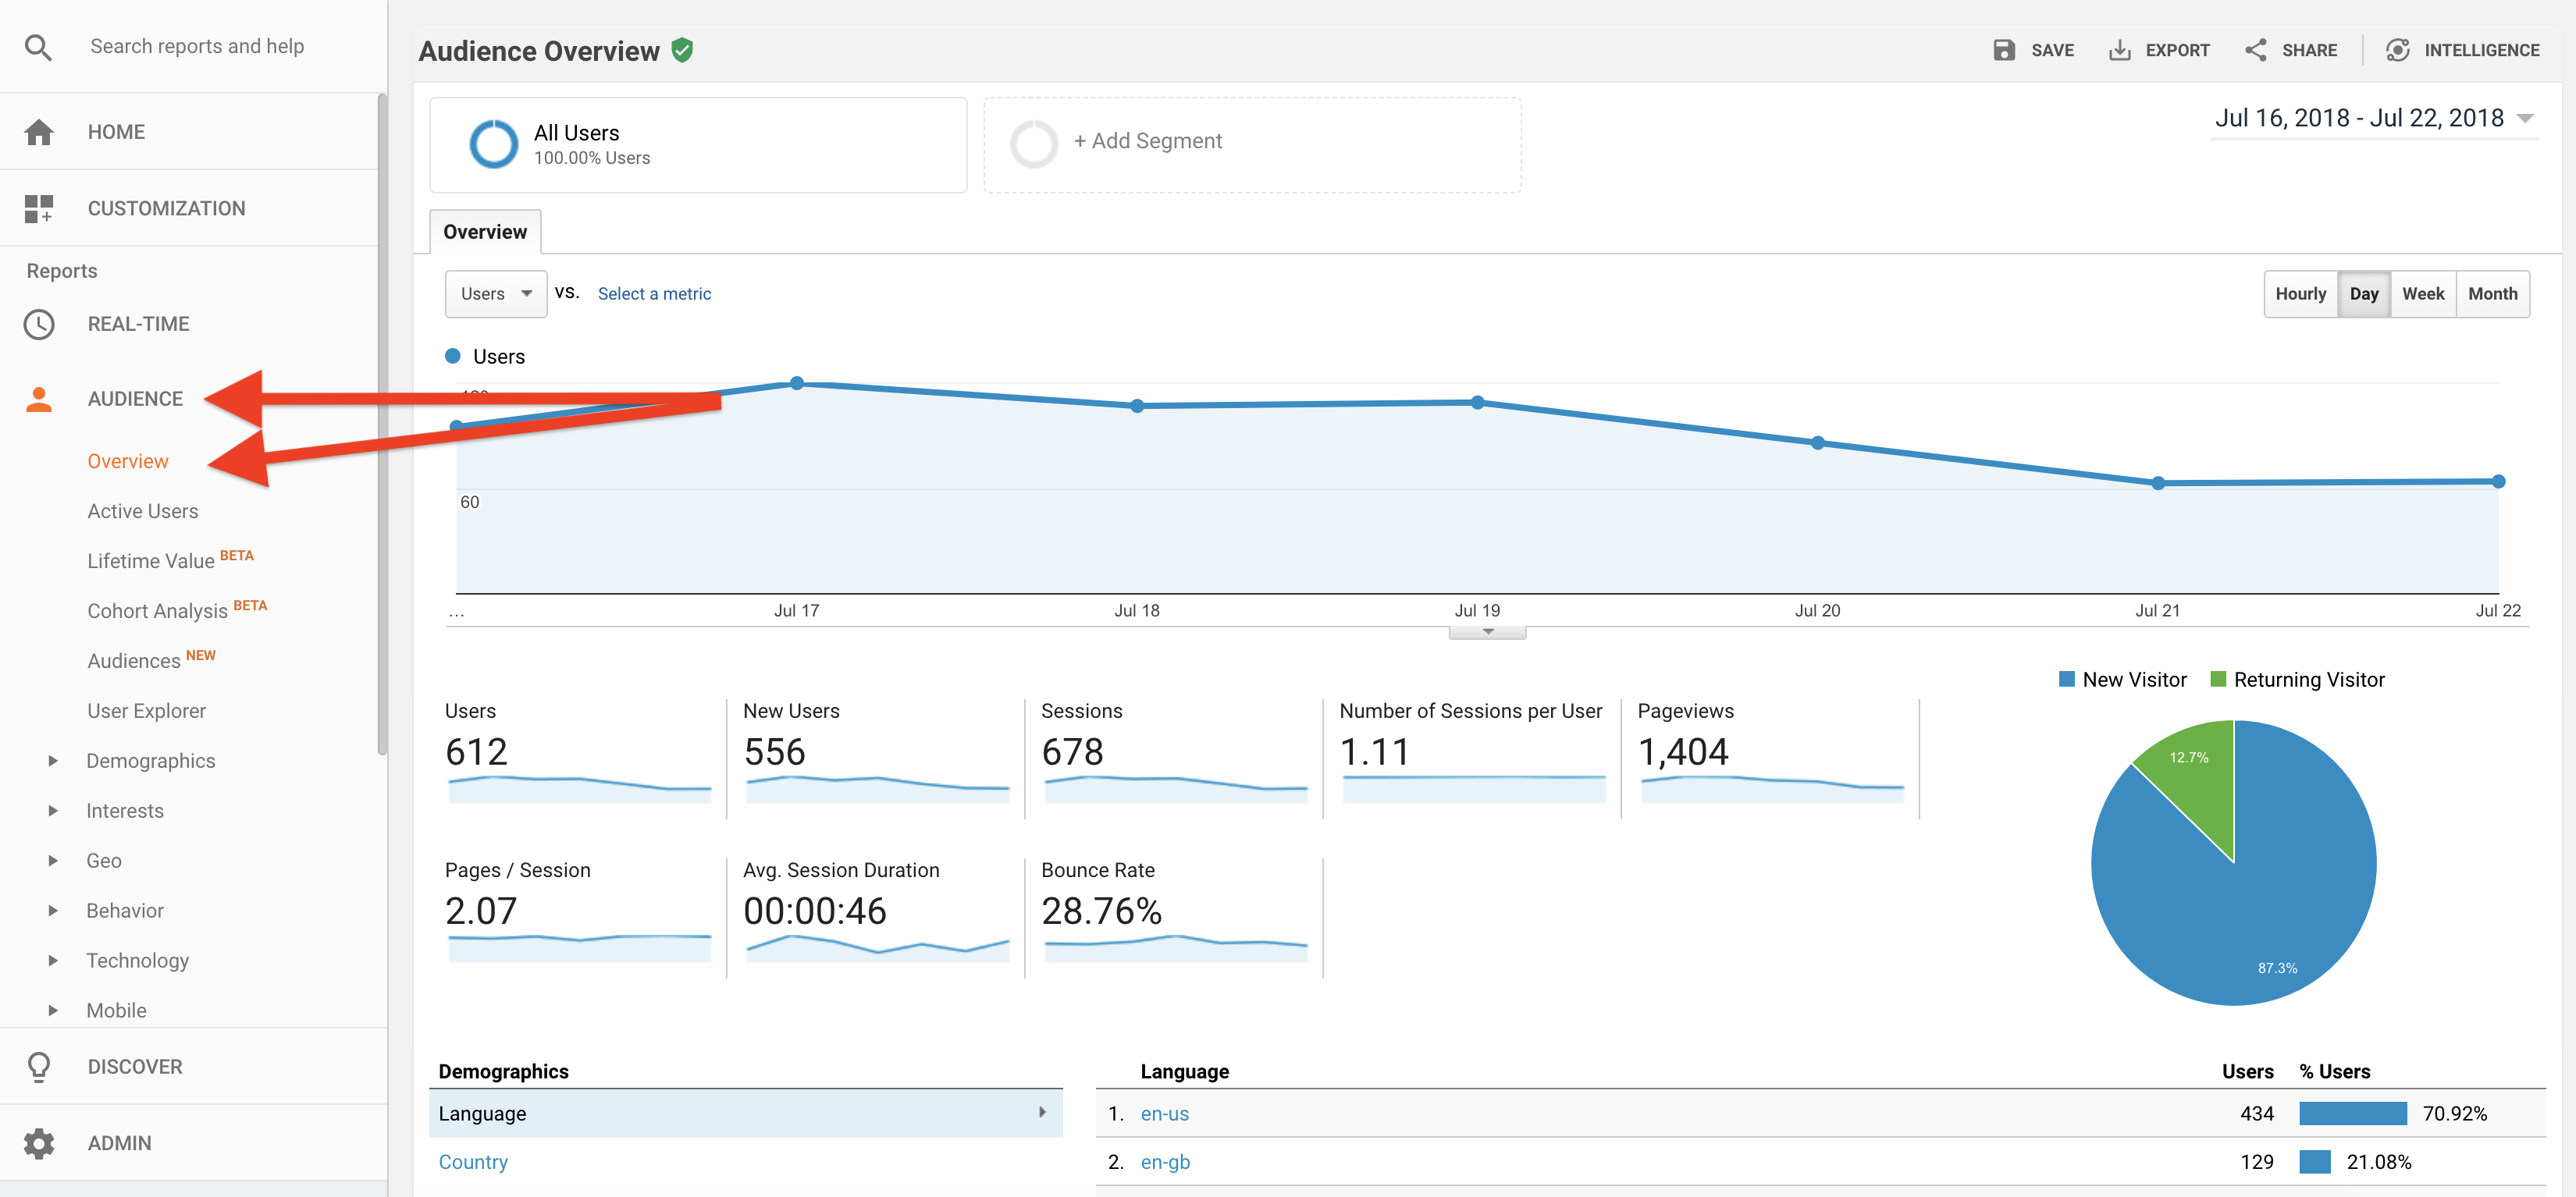
1. Audience Overview
A really simple place to go first is your overview. Here you will get a really big picture of your traffic on your website. You’ll be able to see data from the number of hits to the time on site and the bounce rate (% of people who came to one page and left). This can be really good data to keep an eye on and look for places to improve.
To get this report click ‘Audience’ and then ‘Overview’ from the left hand side.
Key takeaways
- Users – the amount of people to your site
- New users – new traffic (you’ll want returning traffic so hopefully this figure will be lower than the first)
- Pageviews – how many pages were viewed overall
- Bounce rate – you want to keep this as low as possible. You don’t want people going to one page and leaving as it could be a sign your site isn’t loading or offering the help the visitor wanted. This could also reflect the fact that you send a lot of traffic from social media as they generally read and then leave though, so don’t obsess about this.
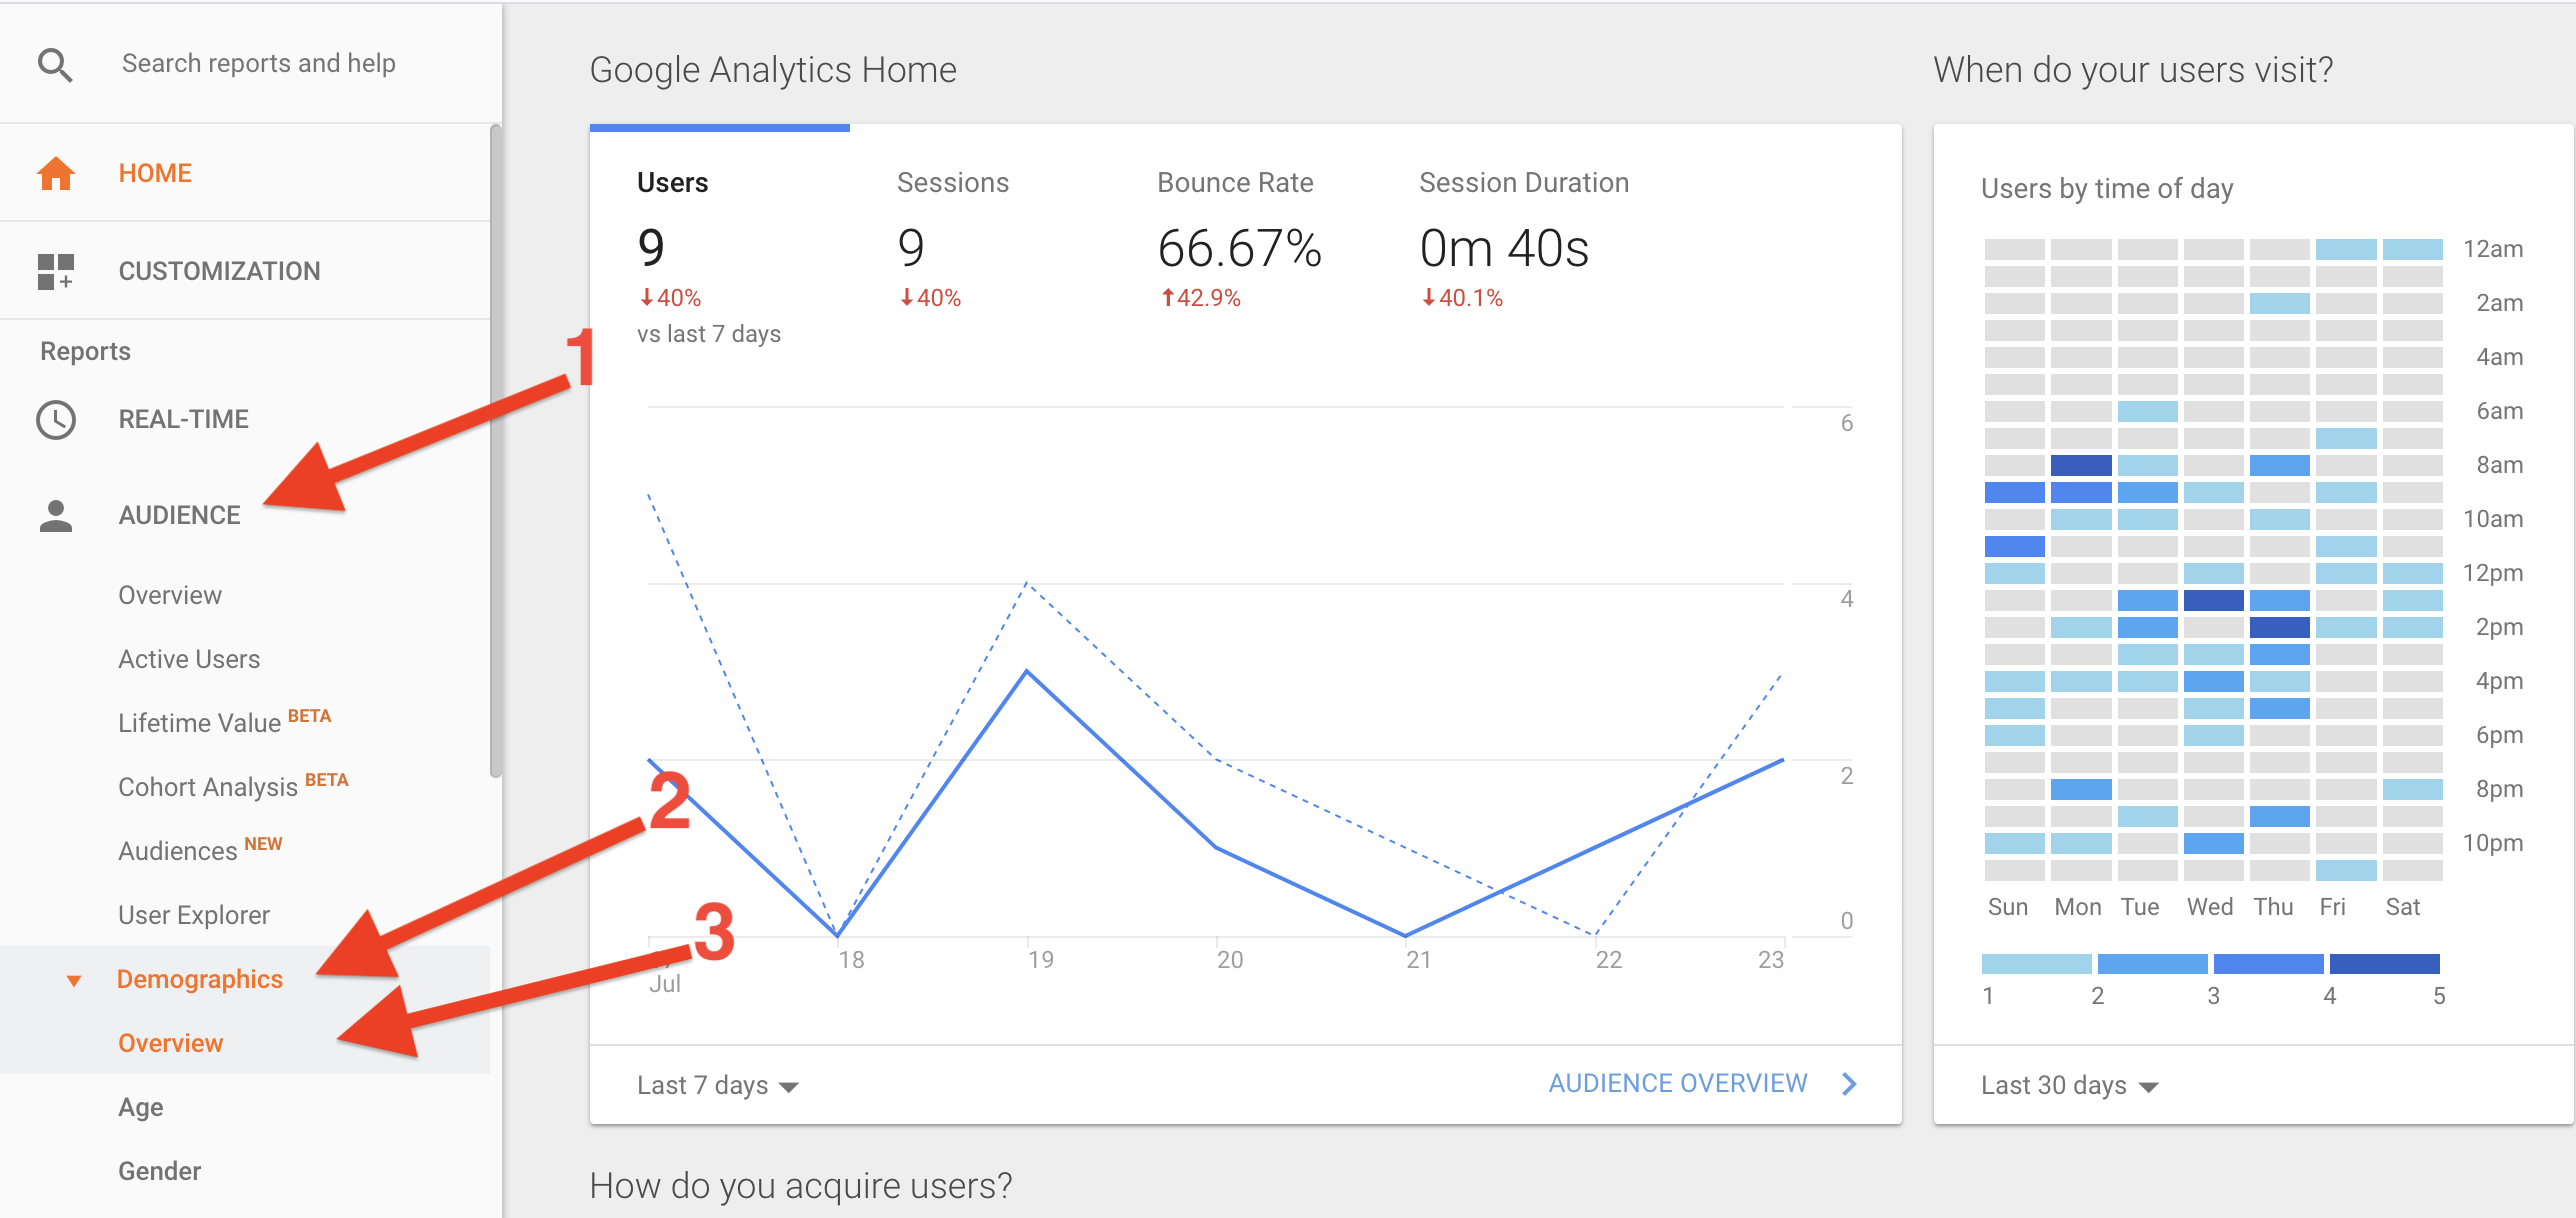
2. Demographics Overview
Next you can take a big picture view of the type of person looking at your site. This will be of particular interest if you’re targeting a certain demographic. If you’re attracting the wrong type then it could suggest that your marketing isn’t working in certain places.
To get this report click on ‘Audience’ then ‘Demographics’ and ‘Overview’ from the left hand side.
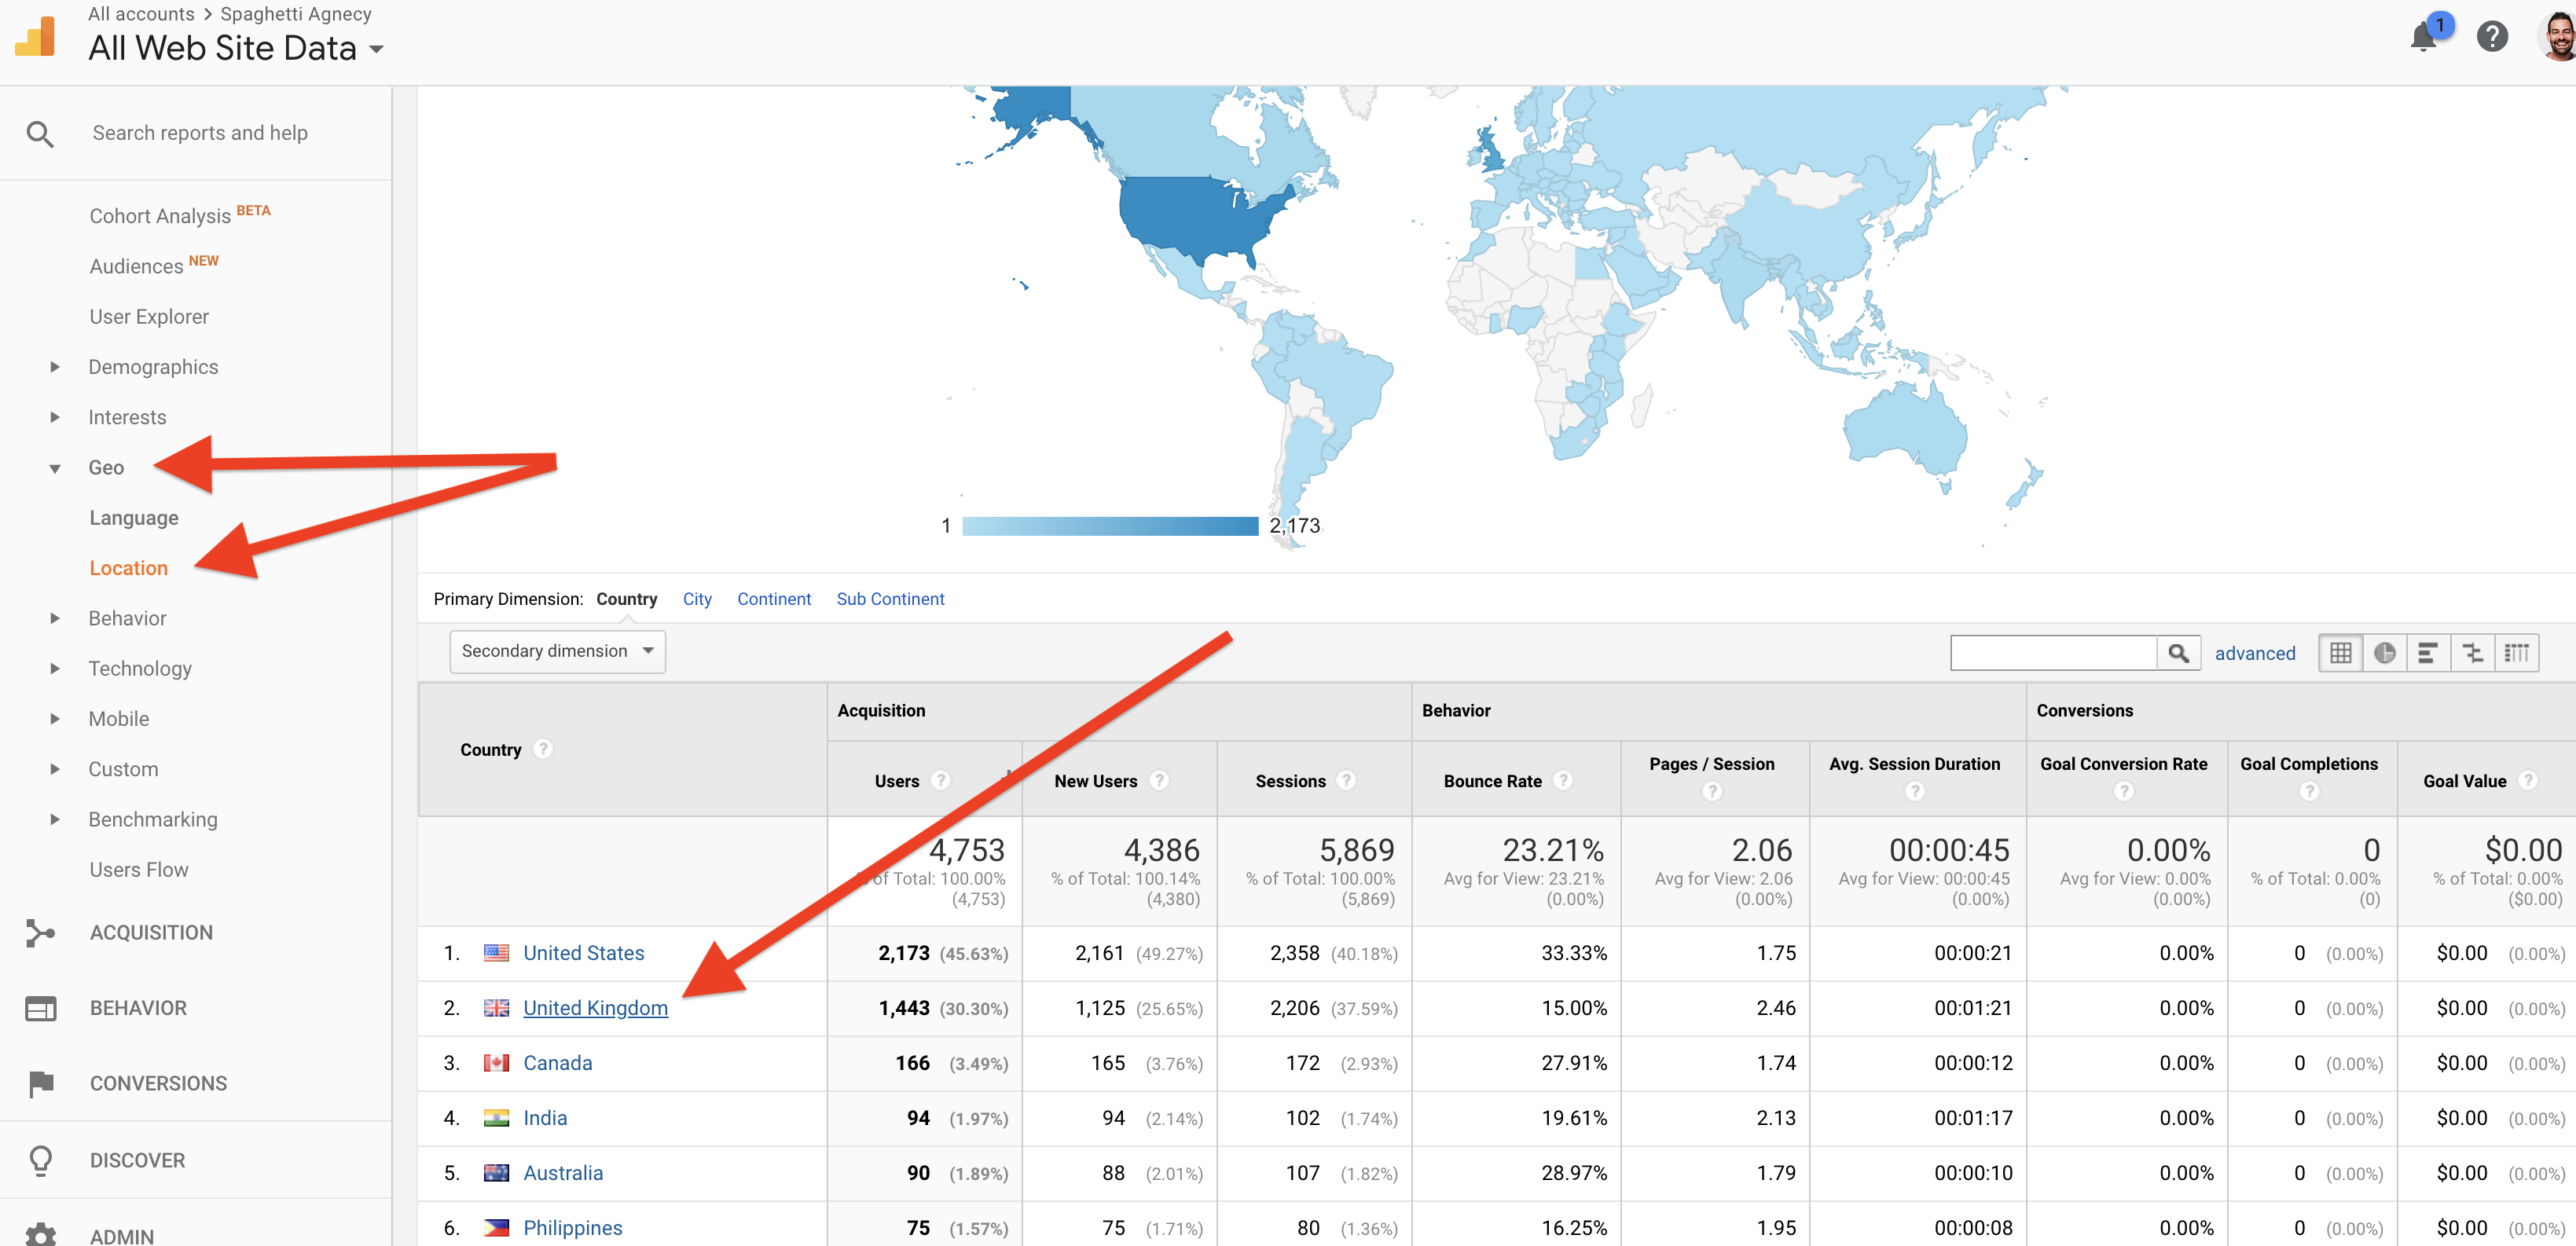
3. Geo Location
Another key area to take a look at is where your traffic is coming from. If you’re a local business then this will really interest you, if you only sell to your own country and don’t ship overseas then this will be useful too.
On each country you can drill down to towns too, which is really cool. This is most likely based on the IP address of the person visiting your site so mobile traffic should be more accurate but as with all this data, add your own common sense to the results.
To get this report click ‘Audience’ then ‘Geo’ and then ‘Location’. (Click on the countries to drill down on the towns).
4. Mobile versus Desktop
Your website needs to be mobile optimised and look good when browsed on the go. This isn’t news to you, I know. One of the great areas of GA is being able to see the split of mobile versus desktop. From here you’ll be able to see what the split is, but more importantly how the different audiences perform on your site.
If you have a higher bounce rate or lower page views from mobile then it could be an indication that your mobile experience isn’t that great. Another area to consider is the page views. If your mobile users are viewing far fewer pages then this could be an indication… but it could also just be because of the way we use our mobiles on websites.
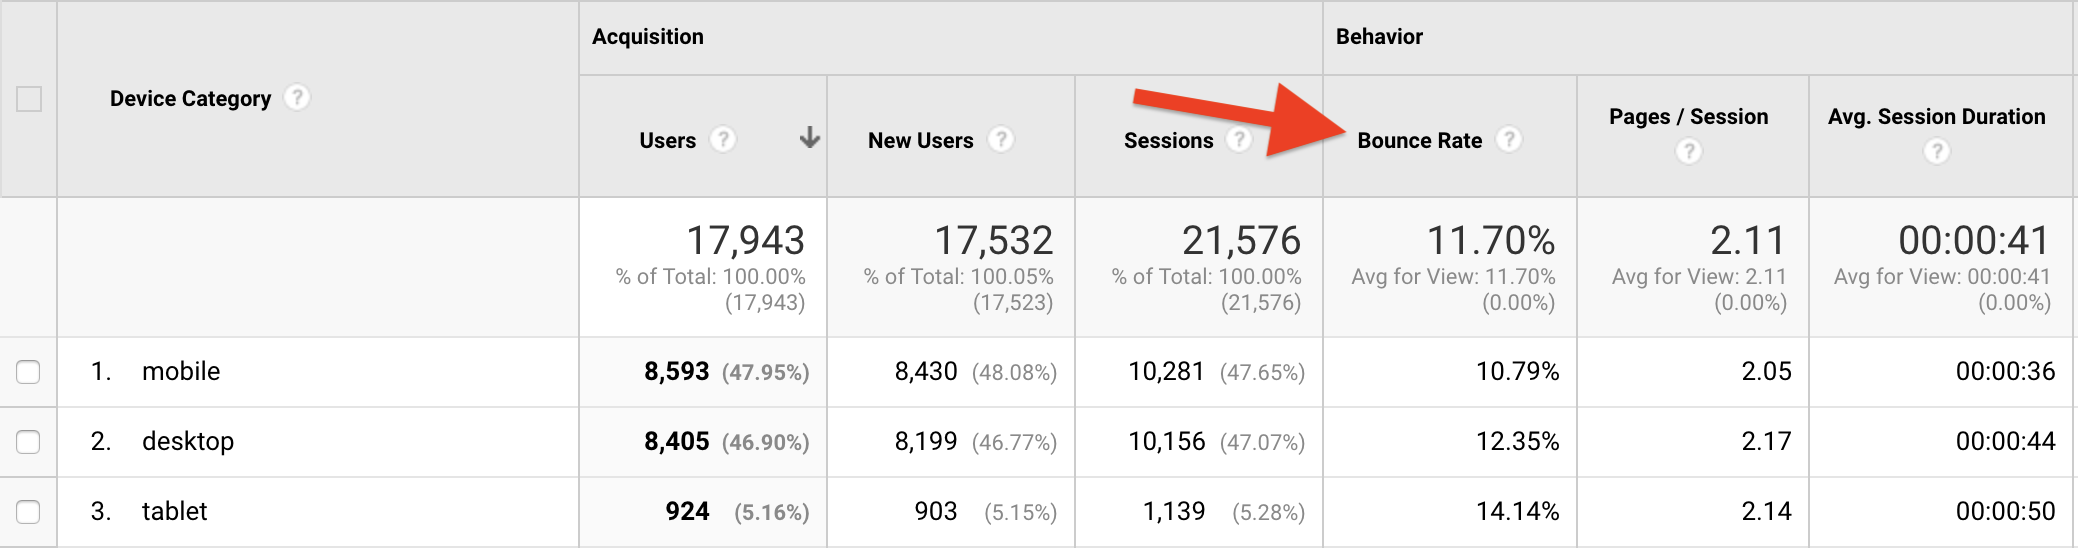
To get this report click ‘Audience’ ‘Mobile’ and then ‘Overview’.
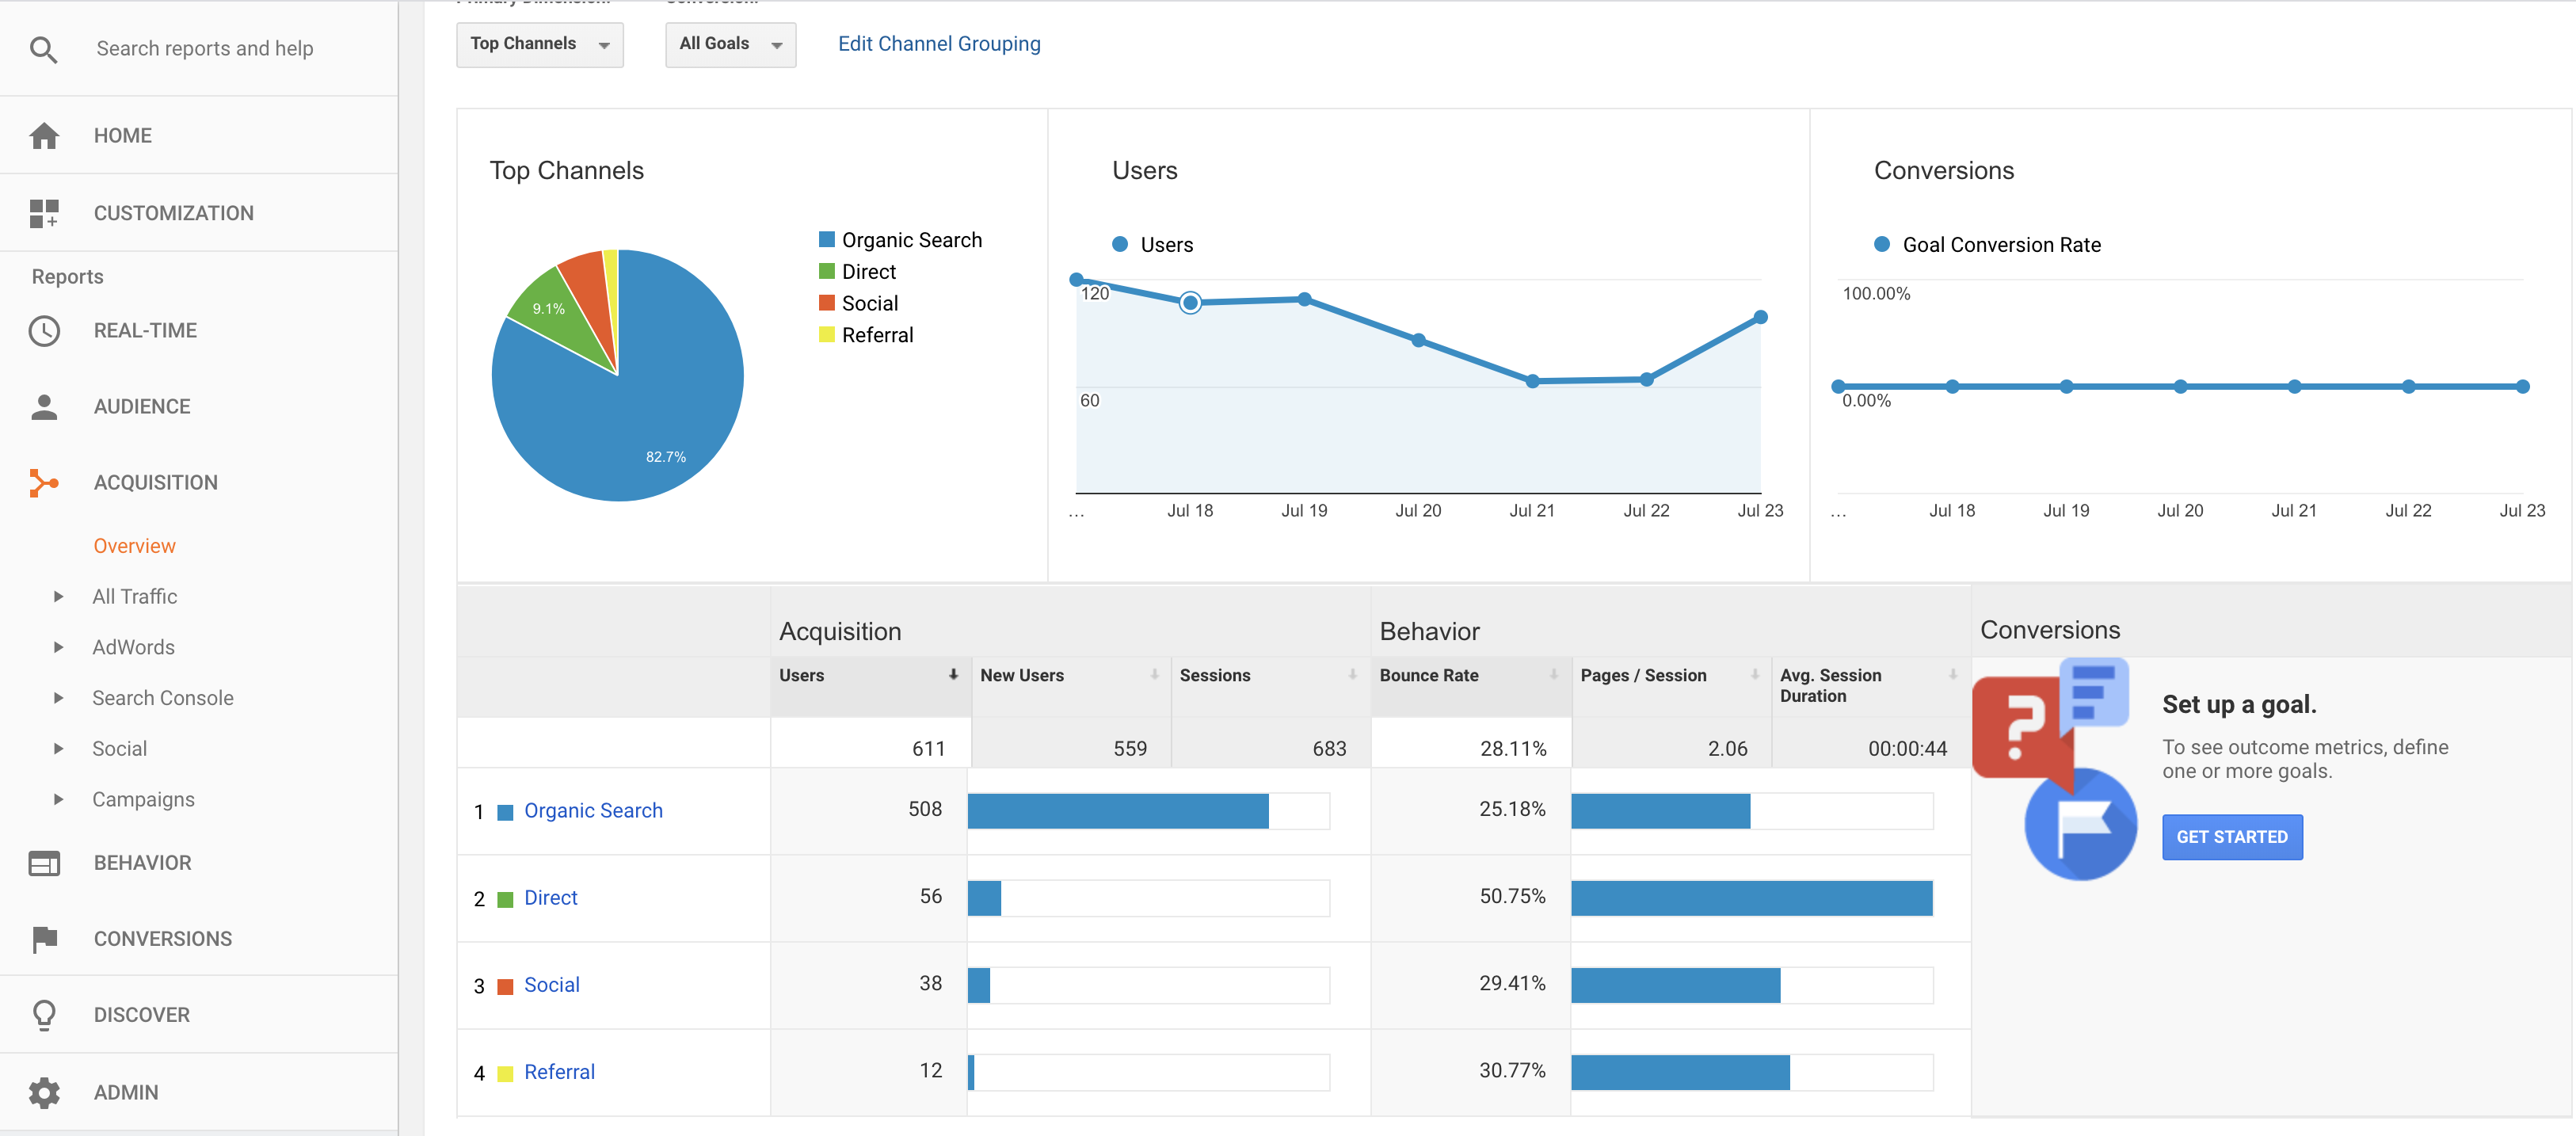
5. Acquisition Overview
Knowing where your audience comes from in the world is important but so is knowing what platform they came from. We’re big into social media so it makes sense for us to check that this is driving traffic. We’ve also spent time and money on SEO (Search Engine Optimisation) so it’s also important for us to see our organic (free) traffic from Google, too.
To get this report head to ‘Acquisition’ then ‘Overview’.
You can drill down on the different channels too by clicking on them like we did here for Social.
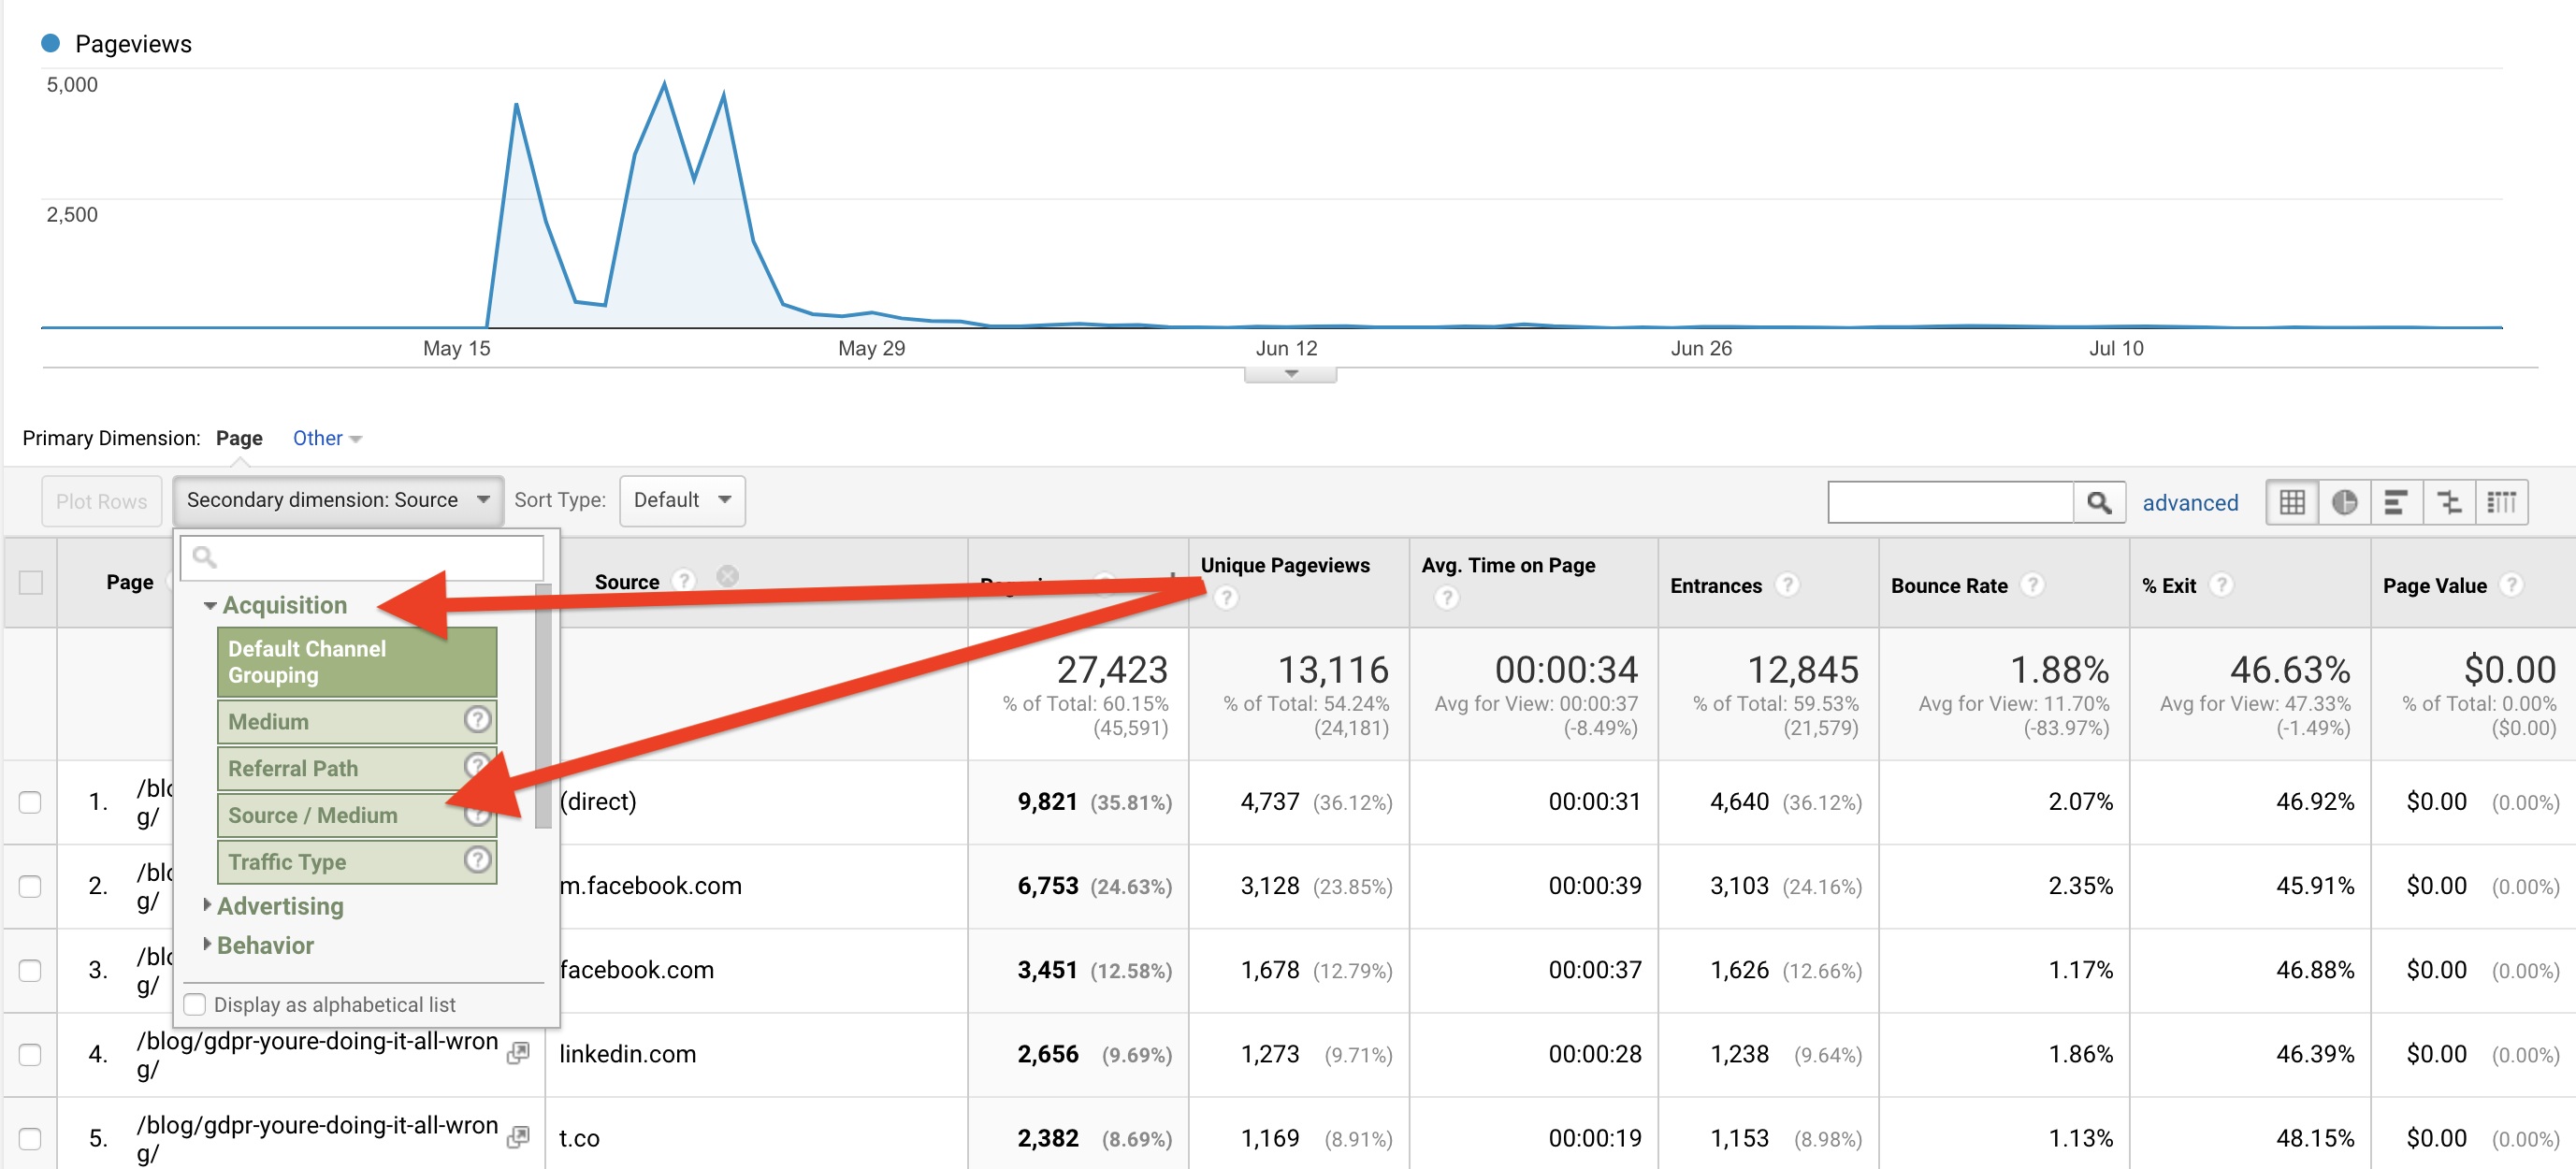
6. Site Pages
This report is my favourite and I use this a lot as I’m a keen blogger. I have this report saved on my mobile app for GA as I check in not long after posting and sharing a blog to see how it’s getting on.
From this report you can see the top pages on your site and all the time, visitor, and bounce rate data for each.
I find the best way to view this data is with a three-month date range and then look at a good segment of pages by clicking on the ‘Show Rows’ button at the bottom (circled in the picture).
To get this report click ‘Acquisition’ then ‘Site Content’ and then ‘All Pages’ and then add more rows from the button at the bottom.
This will give you a really great overview of the pages on your site from the most popular to the least popular and all the data that helps you understand why.
You can click into each page by clicking on the blue URL on the left to see the page on its own and then if you’re really into your data you can add a secondary dimension and then add in ‘Acquisition’ and then ’Source’ to show you your page and which platform sent you traffic.
Simple, effective reporting…
Google Analytics is a powerful tool but it’s only as good as the person who reads it and the actions that they take.
You probably won’t want to faff with these so you can save all these reports once you’ve viewed them by clicking on ‘Save’ on the top bar above the date range so that each one of these reports is then saved in your ‘Customisation’ tab on the left under ‘Saved Reports’
It’s well worth the investment of time to set these up and then view them once a month to get a better idea of your traffic.
Knowing where your views come from, from which platform, and where they go on your site is really useful and makes you a better site owner and marketer.
We view the blog posts to see which ones do better than others to help us understand what content we should (and shouldn’t) create next.
The demographics and geography are incredibly useful too.
If you need any help with these just drop me a message.
Enjoy!
Do You Struggle to Create Content to Generate Sales?
We’ve Created a FREE Online Marketing Plan…
Use our simple ideas generator to help you make better content, over and over again…

Tags associated with this article
Post a comment
We'd love to know what you think - please leave a comment!
99 Simple Marketing Tips
99 Simple Marketing Tips You Can Use to Treble Your Business
Struggling to know where to start with your digital marketing?
We’ve got a tonne of ideas that you can put in place for your marketing – directly from our past 8 years growing an engaged following and strong business.

What You’ll Get
- #ToddsTips
- 4Networking
- AI
- Blogging
- Brand
- Business
- Case study
- Content
- Content Marketing
- Copywriting
- Digtial Marketing Trends
- Email marketing
- Facebook Ads
- Facebook Groups
- Facebook Live
- Google Adwords
- Hashtags
- How to
- Marketing
- Marketing strategy
- Networking
- Outsourcing
- PPC
- PR
- Press Releases
- Proofreading
- SEO
- Social
- Social Media
- Spaghetti Agency
- Storytelling
- Technology
- Uncategorised
- Video
- Video marketing
- Vision
- Websites
- Workshops
- YouTube


0 comments on this article